|
|
 |
 |

 DataCode is proud to offer the very latest in web delivered streaming market data. DataCode is proud to offer the very latest in web delivered streaming market data.
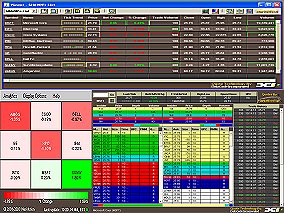
SmartList was designed to bring the power of Marketfeed's real-time streaming data together with Heatmaps from NeoVision and the WorldWatch Level II Viewer into a fully integrated and highly customizable workstation for the Individual Investor and Institutional Trader.
SmartList Users can log on from any PC in the world with an Internet connection to gain access to real-time streaming market data. No downloads are required. Simply log in to SmartList from a browser and access your real-time SmartList workstation.
SmartList truly offers tremendous flexibility and insight into the financial marketplace for today's active investor.
Features:
SmartList Portfolio Viewer
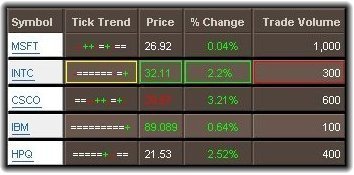 SmartList makes use of industry standard, user-friendly portfolio creation and editing facilities to allow the end user to create and track Multiple Portfolios in Real-Time. Users can track up to 50 real-time instruments in each portfolio. With a simple click of the mouse, users can also enter the number of shares and purchase price for each symbol. If users have multiple entry points for a given security, the application automatically keeps track of all entry points and produces a Dollar Cost Average on the position for that security. Then, by utilizing the Profit (loss) Heatmaps, users can track their individual positions to see what securities are making money and which ones are not. SmartList also allows users to set up various Alerts for an instrument. SmartList makes use of industry standard, user-friendly portfolio creation and editing facilities to allow the end user to create and track Multiple Portfolios in Real-Time. Users can track up to 50 real-time instruments in each portfolio. With a simple click of the mouse, users can also enter the number of shares and purchase price for each symbol. If users have multiple entry points for a given security, the application automatically keeps track of all entry points and produces a Dollar Cost Average on the position for that security. Then, by utilizing the Profit (loss) Heatmaps, users can track their individual positions to see what securities are making money and which ones are not. SmartList also allows users to set up various Alerts for an instrument.
Limit Alerts
Limit Alerts allow the user to set upper and lower price limits for each security in the user’s portfolio. The limits are set by selecting the Edit button on the entry row. The Preference window is displayed with fields for entering the upper and lower limits.
The “Symbol Field” change text color to green if the upper limit is reached and red if the lower limit is reached.
Heatmaps
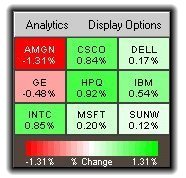 SmartList translates your individual portfolios into colorful Heatmaps automatically. Heatmaps are live "pictures" of financial information used by leading traders, analysts and portfolio managers in some of the largest financial institutions in the world. Heatmaps organize financial instruments or positions into color-coded cells or spots. Using live data, Heatmaps perform calculations in real-time and display the results as color. They are called "Heatmaps" because they show what is Hot. Users can set visual alerts to highlight important opportunities, critical information or current results. Heatmaps focus time and attention on the few pieces of information that are most important at this moment. SmartList translates your individual portfolios into colorful Heatmaps automatically. Heatmaps are live "pictures" of financial information used by leading traders, analysts and portfolio managers in some of the largest financial institutions in the world. Heatmaps organize financial instruments or positions into color-coded cells or spots. Using live data, Heatmaps perform calculations in real-time and display the results as color. They are called "Heatmaps" because they show what is Hot. Users can set visual alerts to highlight important opportunities, critical information or current results. Heatmaps focus time and attention on the few pieces of information that are most important at this moment.
Track instruments by Price Movement or by Profit and Loss. Display and/or sort data on %change, Last Sale, Net Change, Previous Close, Share Volume, Symbol, and Weighted Spread in Basis Points, in both Ascending and Descending order. Create Default Heatmaps with the click of a button for faster access to information.
Someone once said that, "A picture is worth a thousand words". Never has that saying had more meaning than with Heatmaps. In a single glance, the user can differentiate market movement like never before. Using the mouse-over feature in Heatmaps, users can gain more insight into the price movement by viewing important information such as: Last Sale, Net Change, Bid and Ask, Weighted Spread in Basis Points, Volume, Today's High and Low as well as viewing a Tick Chart on today's activity.
Nasdaq Level II
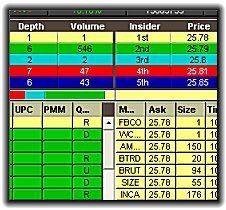 SmartList also allows the user to launch the WorldWatch Level II Viewer directly to view NASDAQ Level II Quotes. With the WorldWatch Level II Viewer, users can gain unprecedented access into the inside marketplace of Nasdaq Market-Makers. SmartList also allows the user to launch the WorldWatch Level II Viewer directly to view NASDAQ Level II Quotes. With the WorldWatch Level II Viewer, users can gain unprecedented access into the inside marketplace of Nasdaq Market-Makers.
The WorldWatch Level II Viewer displays a given security, by color - according to their relative position from the Bid and Offer at any given time during market hours. This information is used by financial institutions worldwide and is a "must-have" for all professional U.S. equity traders, as well as non-professional Day-Traders as it provides the serious trader with unequaled insight into the bid/offer side of the market from every Market Maker on NASDAQ and Small Cap Market issues.
With the WorldWatch® Level II Viewer, you can view Real-Time supply and demand for any Market Maker-driven equity. You can gain an unprecedented insight into the minds of those controlling the market. You can use it to take advantage of the minor price differences between the bid/offer spread to capture profits or you can use it to time your entry and exit points used in momentum trading strategies.
Sign Up Today!
SmartList is available as a standalone service for the single user. For SMB and Enterprise usage contact DataCode at info@datacodeinc.com.
|
|